Approaching Retirement? Which Line Would Let You Sleep Better?
Approaching Retirement? Which Line Would Let You Sleep Better?
Why the market’s recent run is only half the story when your paycheck is about to stop
Picture two lines on a chart. One climbs, falls hard, climbs again, falls again, and then soars. The other climbs, levels off, climbs again, and never dips below where it started. Both begin with the same $100,000 in September 1999.
Now picture yourself a year or two from retirement, with your paycheck about to stop, and ask one honest question: which of those lines would let you sleep better at night?
Two lines, one starting point
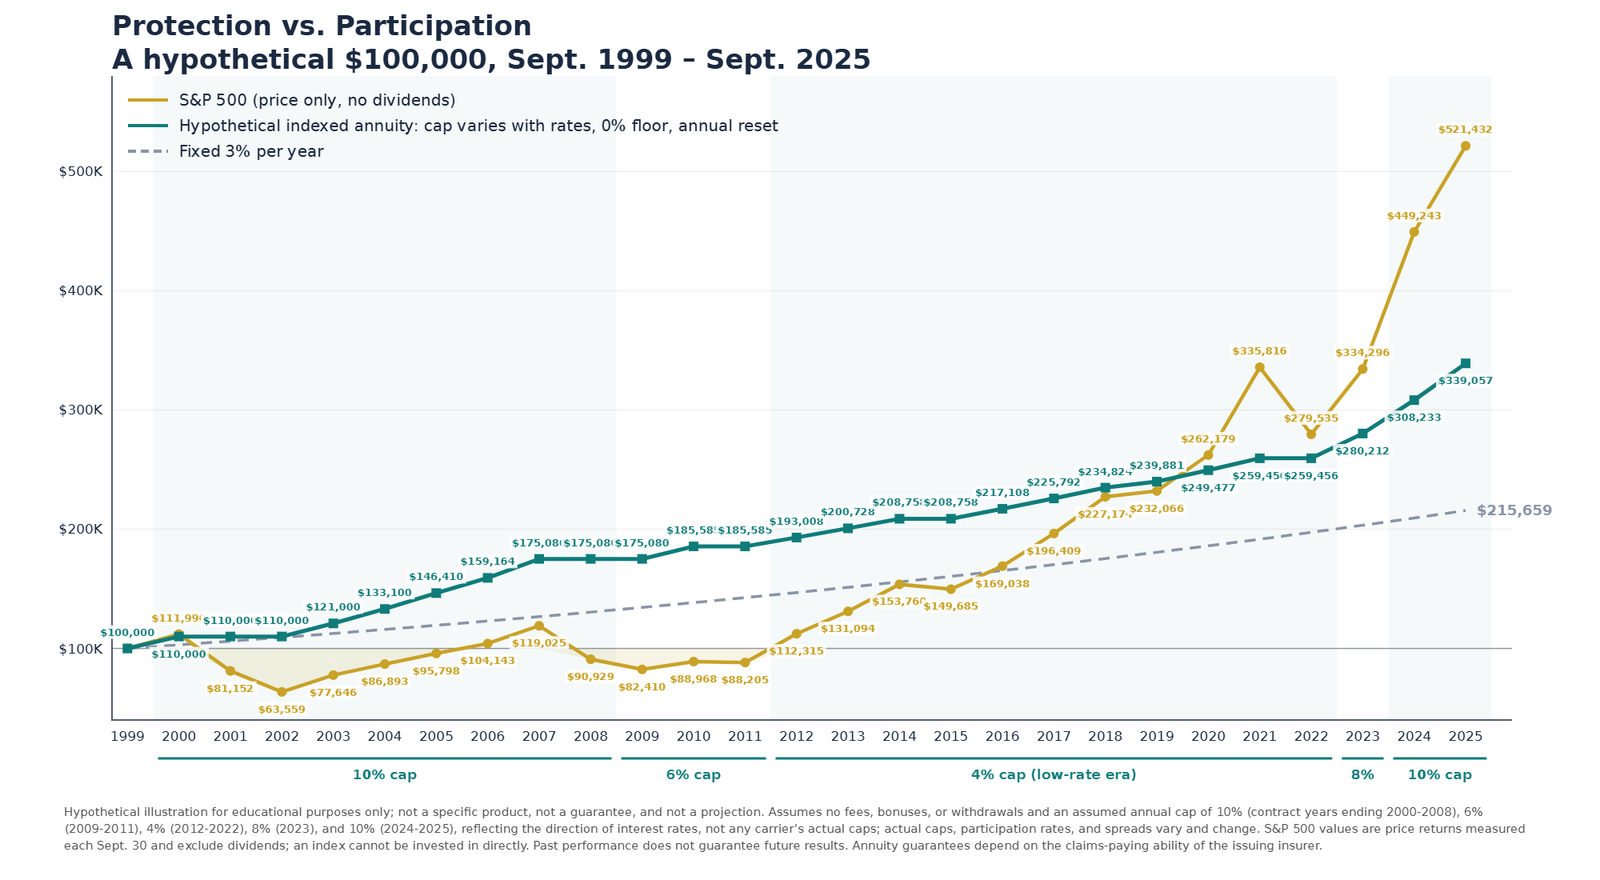
The charts below follow three hypothetical paths for $100,000. The gold line is the S&P 500 (price only, without dividends). The teal line is a hypothetical fixed indexed annuity (FIA) with a 0% floor and an annual cap that rises and falls with interest rates. The dashed line is a flat 3% fixed rate. The first chart ends in September 2023; the second carries the same illustration through September 2025.
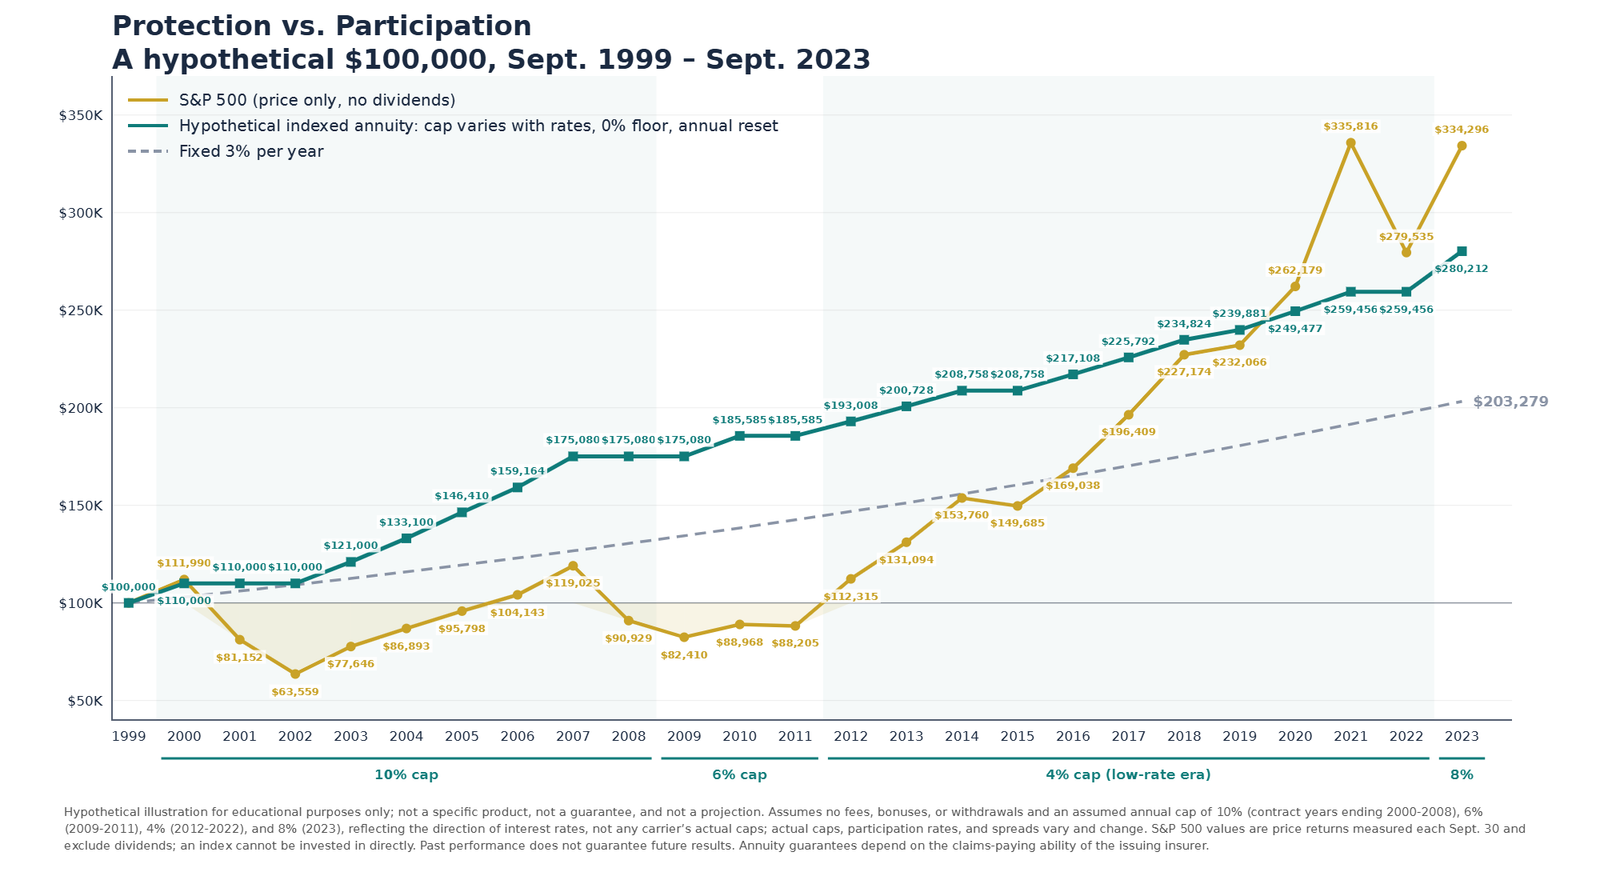
Through 2023, the market line finishes ahead: about $334,000, compared with about $280,000 for the annuity and about $203,000 for the fixed rate. But look at the road each line took to get there. The annuity line was ahead every year from 2001 through 2019 and never dropped below its starting $100,000. The market line spent most of the first twelve years underwater.
The market’s recent run is real
There’s no point pretending otherwise. From September 2020 to September 2025, the S&P 500’s price nearly doubled. In the extended chart, the market line finishes at roughly $521,000, well ahead of the annuity’s roughly $339,000. If you’ve been invested through this stretch, you’ve likely watched your balances grow in ways that feel great, and that growth matters.
But history doesn’t only move up
A chart that ends on a high point makes it easy to forget the stretches that didn’t. Within these same 26 years, the dot-com bust of 2000 to 2002 cut the index roughly in half from peak to bottom, and in the chart a $100,000 starting balance fell to about $63,500 by September 2002. The 2007 to 2009 financial crisis took the index down more than 50% from its peak, and the market line was still below its 1999 starting point as late as September 2011, twelve years later. In 2022, another bear market erased roughly a quarter of the index’s value from its high.
In those same years, the annuity line simply flattened. It didn’t grow, but it didn’t give anything back.
Why a downturn’s timing matters most near retirement
During your working years, a market decline is painful but survivable. You’re still adding money, often buying at lower prices, and you have time on your side. As retirement approaches, three things change at once: new contributions stop, withdrawals begin, and the time you have to recover shrinks.
Withdrawing money during a decline means selling at lower prices, and those dollars aren’t there to participate when the market recovers. That’s why two retirees with the same average return can end up in very different places based purely on the order in which the good and bad years arrive. We walked through exactly that scenario in One Decision, Two Outcomes: A Retirement Case Study.
This is the “if.” No one knows when the next down cycle will come. It may be years away. But if it arrives in the years just before or just after you retire, it could undo a meaningful share of what took you decades to build, at exactly the moment you have the least time and the fewest options to rebuild it.
What the protected line gives up, and what it buys
To be clear, the annuity line gave up upside. Its caps limited gains in strong years, and over the full period through 2025 the market line finished well ahead. A fixed indexed annuity is not a stock market investment, does not receive dividends, and typically carries surrender charges and withdrawal limits during its early years. Caps and other crediting terms can change.
What it offers in exchange is a floor. Gains that are credited are locked in, and index losses are not subtracted from the account value. That trade-off, some upside for protection from loss, is why the teal line never fell below $100,000.
It doesn’t have to be one line or the other
Many people approaching retirement don’t choose a single line. They set aside the money they’ll need for income and near-term expenses in places designed to protect it, and keep another portion positioned for long-term growth. The right balance depends on your income needs, other sources such as Social Security or a pension, your health, your taxes, and, just as importantly, how you would honestly feel watching your savings drop 30% in the year you retire.
So, which line would let you sleep better?
You’ve worked too hard to get here to leave the answer to chance. If you’re within five to ten years of retirement, or already in it, it’s worth knowing how much of what you’ve built would be exposed if the next downturn arrived early, and what options exist to put a floor under the part you can’t afford to lose.
To learn more about how these contracts work, read How Does a Fixed Indexed Annuity Work? Pros and Cons Explained. When you’re ready to talk through your own situation, I’d welcome the conversation.
Schedule a Conversation →Ron Greene is a licensed insurance professional and Investment Adviser Representative. The charts in this article are hypothetical illustrations for educational purposes only. They do not represent any specific product or actual client, are not a guarantee, and are not a projection of future results. The annuity illustration assumes no fees, bonuses, or withdrawals, a 0% floor, and an assumed annual cap of 10% (contract years ending 2000 to 2008), 6% (2009 to 2011), 4% (2012 to 2022), 8% (2023), and 10% (2024 to 2025), chosen to reflect the general direction of interest rates rather than any carrier’s actual caps. S&P 500 values are price returns measured each September 30 and exclude dividends; an index cannot be invested in directly. Past performance does not guarantee future results.
Fixed indexed annuities are insurance products, not a direct investment in the market; features, caps, participation rates, riders, and guarantees vary by carrier and contract, and are backed by the issuing insurance company subject to state guaranty association limits. Surrender charges may apply to withdrawals during the surrender period, and withdrawals before age 59½ may be subject to a 10% federal tax penalty. This is not investment, legal, or tax advice. Consult a qualified professional regarding your specific situation. S&P 500® is a registered trademark of S&P Dow Jones Indices LLC.